

Great Barrier Reef: coral bleaching heat stress
How close the corals of the Great Barrier Reef are to bleaching: NOAA satellites compare the water at its 7 reef areas with each reef's normal summer peak, add up the extra heat over the last 12 weeks and give each reef an alert level. Figures for November 20, 2026, updated once a day. How to read it
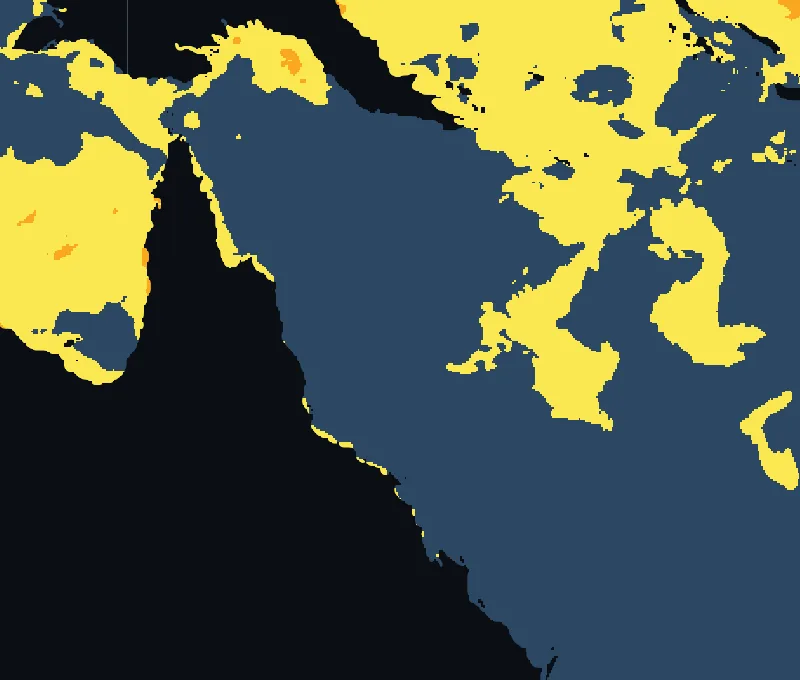 Far Northern GBRTorres StraitCentral GBRNorthern Coral Sea IslandsNorthern GBRSouthern Coral Sea IslandsSouthern GBR
- No stress
- Bleaching Watch
- Bleaching Warning
- Alert Level 1
- Alert Level 2
- Alert Level 3
- Alert Level 4
- Alert Level 5
Open the interactive heat-stress map
Reef areas of the Great Barrier Reef
| Reef area | Alert today | Heat built up, 12 weeks (°C°F-weeks) | Water today | Above its summer peak | Where |
|---|---|---|---|---|---|
| Far Northern GBR | Bleaching Watch | 0.00.0 | 29.2°C84.6°F | +0.2°C+0.4°F | 13°S 144°E |
| Torres Strait | Bleaching Watch | 0.00.0 | 29.4°C84.8°F | +0.1°C+0.2°F | 10°S 144°E |
| Central GBR | No stress | 0.00.0 | 27.7°C81.9°F | no | 19°S 148°E |
| Northern Coral Sea Islands | No stress | 0.00.0 | 27.8°C82.0°F | no | 16°S 149°E |
| Northern GBR | No stress | 0.00.0 | 28.2°C82.7°F | no | 16°S 146°E |
| Southern Coral Sea Islands | No stress | 0.00.0 | 27.1°C80.8°F | no | 21°S 154°E |
| Southern GBR | No stress | 0.00.0 | 27.1°C80.7°F | no | 23°S 151°E |
Source: NOAA Coral Reef Watch
Values for each reef area as NOAA Coral Reef Watch publishes them for its virtual stations. Heat stress is a risk of bleaching, not a report of bleached corals. What the alert levels mean.
The world’s largest reef system
The Great Barrier Reef stretches for about 2,300 km1,400 mi along the coast of Queensland, from the Torres Strait in the north to the reefs off Gladstone and Bundaberg in the south. NOAA Coral Reef Watch follows it in five reef areas, the Torres Strait and the Far Northern, Northern, Central and Southern Great Barrier Reef, and adds the reefs of the Coral Sea Islands further offshore, north and south.
When the heat builds
The Great Barrier Reef bleaches in the southern summer. The water is warmest in February, when it averages 29.3°C84.7°F off Cairns over 2003 to 2025, and February and March are the months of highest risk; the managers of the marine park watch for heat stress from December to March. Outside that season the alerts here usually read no stress.
Mass bleaching since 1998
Scientists of the Australian Institute of Marine Science have documented mass bleaching on the reef in 1998, 2002, 2016, 2017, 2020, 2022, 2024 and 2025. Before 1998 such events were rare. The back-to-back events of 2016 and 2017 affected about two thirds of the reef, and in 2024, for the first time, extreme bleaching was seen in all three regions of the reef, north, centre and south. 2025 was the second time the reef bleached in two consecutive years, although less severely than in 2024.