

Ocean currents map
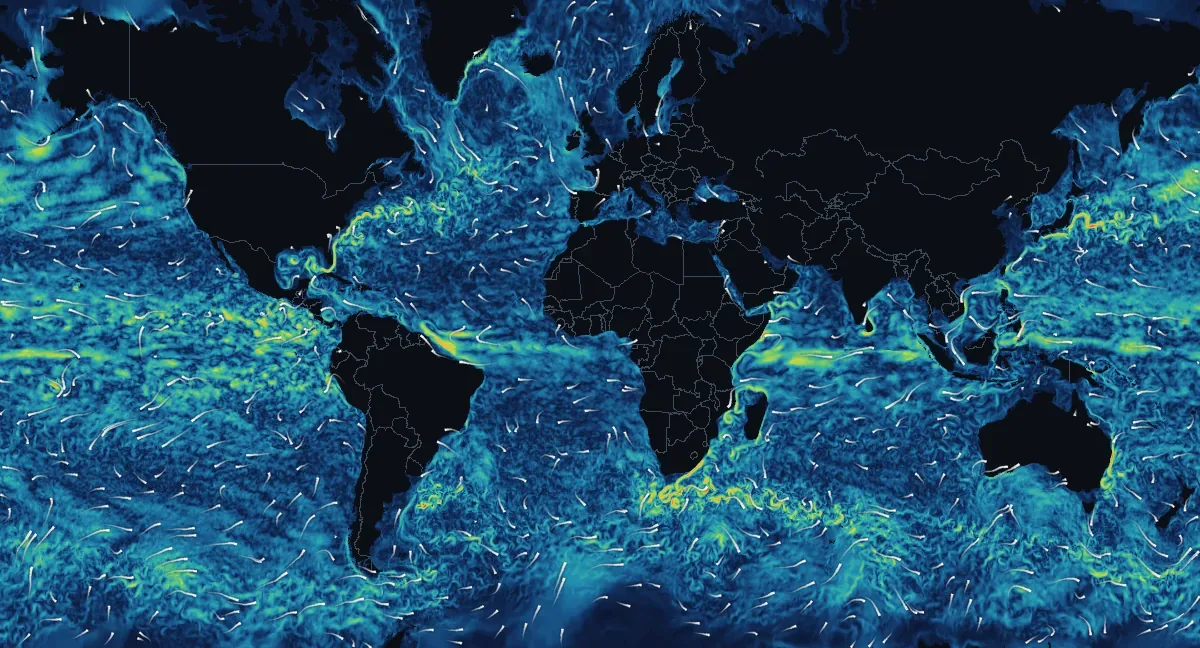
How fast the water moves at the ocean surface and where it flows, from NOAA's RTOFS ocean model, for November 22, 2026, 00:00 UTC. The map is updated once a day.
Open the interactive currents map
The big currents today
| Current | Fastest water | Flowing toward | Where |
|---|---|---|---|
| Kuroshio | 7.4 km/h4.6 mph | the east | 35°N 148°E |
| Agulhas Current | 7.2 km/h4.5 mph | the northeast | 40°S 21°E |
| East Australian Current | 7.0 km/h4.3 mph | the south-southwest | 30°S 154°E |
| Somali Current | 6.3 km/h3.9 mph | the south-southwest | 5°N 49°E |
| Gulf Stream | 6.1 km/h3.8 mph | the north-northwest | 31°N 74°W |
| North Brazil Current | 5.8 km/h3.6 mph | the northwest | 3°N 48°W |
How the speeds are measured
The fastest 25 km16 mi cell inside a fixed box drawn around each current. Speeds are the model's surface current, averaged over the cell.
Surface currents by ocean and sea
| Ocean or sea | Average | Fastest | Faster than 1.8 km/h1.1 mph |
|---|---|---|---|
| Atlantic Ocean | 0.8 km/h0.5 mph | 8.8 km/h5.5 mph 42°S 53°W | 6% |
| Pacific Ocean | 1.0 km/h0.6 mph | 7.4 km/h4.6 mph 35°N 148°E | 11% |
| Indian Ocean | 1.0 km/h0.6 mph | 7.2 km/h4.5 mph 40°S 21°E | 10% |
| Arctic Ocean | 0.3 km/h0.2 mph | 3.5 km/h2.2 mph 66°N 168°W | 0% |
| Southern Ocean | 0.5 km/h0.3 mph | 3.2 km/h2.0 mph 63°S 73°W | 1% |
| Gulf of Mexico | 1.0 km/h0.6 mph | 5.7 km/h3.5 mph 24°N 83°W | 15% |
| Caribbean Sea | 1.0 km/h0.6 mph | 4.4 km/h2.7 mph 21°N 87°W | 9% |
| Mediterranean Sea | 0.5 km/h0.3 mph | 3.6 km/h2.2 mph 36°N 5°W | 1% |
| North Sea | 0.3 km/h0.2 mph | 1.7 km/h1.0 mph 58°N 10°E | 0% |
How the seas are counted
Oceans and seas are drawn as on their own pages, so a sea is also counted in its ocean.
What the map shows
The colours are the speed of the water at the surface, the top few metres of the ocean: dark blue water barely moves, teal and green water drifts at up to a slow walking pace, and yellow, orange and red mark the fastest currents, which can run at more than 7 km/h4 mph. The white streaks show where the water is going: each one runs toward its bright end, and longer streaks mean faster water.
Most of the ocean moves slowly. The fast water gathers in narrow currents along the western side of each ocean basin, the Gulf Stream off the United States, the Kuroshio off Japan, the Agulhas off South Africa, and in the bands that run along the equator. Between them, slow swirls tens to hundreds of kilometres across, called eddies, break away from the big currents and drift for months. The guide What drives ocean currents explains why.
How to read the map
Tap or click the water on the interactive map for the speed and the direction it flows toward, in km/h or mph with knots alongside. With a mouse, the speed under the pointer shows as you move over the picture. Positions in the tables pin their spot on the map. Current direction is given as where the water goes, the opposite of winds and waves, which are named for where they come from.
Where the numbers come from
NOAA's Real-Time Ocean Forecast System (RTOFS Global), run once a day by the National Centers for Environmental Prediction on the HYCOM ocean model, computes the currents on a grid of about 9 km6 mi, using satellite and ocean-float observations. This map shows its analysis at 00 UTC of each day, averaged into cells of about 25 km16 mi. It describes the open ocean: near the coast, tidal streams, rip currents and the flow around headlands and harbour mouths can be much stronger and are not shown, so never use this map to judge whether it is safe to swim, and never for navigation.