

Ocean temperature anomaly map
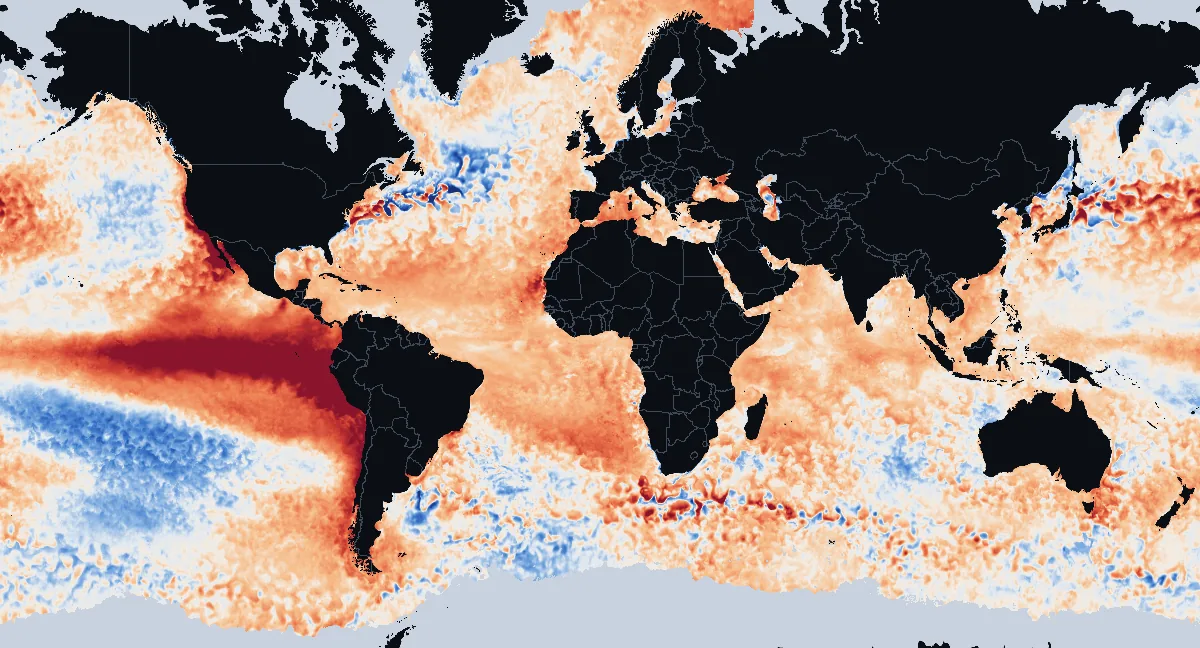
How much warmer or cooler than normal the sea surface is today, compared with the 1991–2020 average for the same date, from NOAA Coral Reef Watch satellite data for November 21, 2026. Updated once a day.
Open the interactive anomaly map
Oceans and seas compared with normal
| Ocean or sea | Average anomaly | Share at least 1°C2°F warmer | Share at least 1°C2°F cooler |
|---|---|---|---|
| Arctic Ocean | +1.0°C+1.8°F | 47% | 0% |
| Pacific Ocean | +0.9°C+1.7°F | 36% | 7% |
| Atlantic Ocean | +0.8°C+1.4°F | 44% | 3% |
| Southern Ocean | +0.7°C+1.3°F | 29% | 0% |
| Indian Ocean | +0.6°C+1.2°F | 27% | 1% |
| Gulf of Mexico | +1.0°C+1.8°F | 57% | 2% |
| Mediterranean Sea | +1.0°C+1.8°F | 45% | 0% |
| Caribbean Sea | +1.0°C+1.8°F | 50% | 0% |
| North Sea | +0.6°C+1.1°F | 15% | 2% |
How the seas are counted
Oceans and seas are drawn as on their own pages, so a sea is also counted in its ocean. The polar oceans count only open water: cells under sea ice have no anomaly.
Furthest from normal today
Warmest compared with normal
- +9.1°C+16.4°F South Pacific Ocean, off Peru
- +7.1°C+12.8°F South Pacific Ocean, off Ecuador
- +6.5°C+11.7°F South Pacific Ocean
- +6.3°C+11.3°F North Pacific Ocean, off the United States
- +5.8°C+10.4°F South Pacific Ocean
Coolest compared with normal
- −5.8°C−10.4°F North Atlantic Ocean
- −3.2°C−5.8°F South Atlantic Ocean, off Argentina
- −3.0°C−5.4°F Sea of Japan, off Russia
- −2.6°C−4.7°F South Pacific Ocean
- −2.4°C−4.3°F South Pacific Ocean
How the places are picked
Averages over 1° cells (about 110 km, 70 mi) at least 1,500 km930 mi apart, within 70° of the equator. Tap a place to pin it on the map above.
Seas, gulfs and bays
Warmest compared with normal
- +3.6°C+6.4°F Gulf of California
- +1.8°C+3.2°F Barents Sea
- +1.5°C+2.6°F Bay of Campeche
- +1.3°C+2.4°F Bass Strait
- +1.2°C+2.2°F Gulf of Carpentaria
- +1.1°C+2.1°F Sargasso Sea
- +1.1°C+2.0°F Laccadive Sea
- +1.1°C+1.9°F Greenland Sea
- +1.0°C+1.9°F Black Sea
- +1.0°C+1.9°F Mediterranean Sea
Closest to normal or cooler
- −0.3°C−0.6°F Davis Strait
- ±0.0°C±0.0°F Solomon Sea
- ±0.0°C+0.1°F Bering Sea
- +0.1°C+0.3°F Arafura Sea
- +0.2°C+0.4°F Sea of Okhotsk
- +0.3°C+0.5°F Molucca Sea
How the seas are measured
Average anomaly over each named sea, gulf or bay of at least 100,000 km² (39,000 sq mi), outlined as in Natural Earth's marine areas.
What the map shows
An anomaly is the difference between today's sea surface temperature and the average for the same date over 1991 to 2020. Red water is warmer than that average, blue water cooler, and near-white water within a quarter of a degree of it. The colours run from −4.0°C−7.2°F to +4.0°C+7.2°F; anything beyond is shown in the deepest red or blue.
Most of the ocean is slightly red on most days now: the sea surface has warmed since the 1991–2020 period, so an ordinary day today is a little warmer than an average day then. Large patches of deep red or blue mean something more: El Niño and La Niña warm or cool the eastern tropical Pacific by several degrees, marine heatwaves can hold a sea several degrees above normal for weeks, and in the Gulf Stream, the Kuroshio and the currents around Antarctica red and blue spots sit side by side where eddies and meanders have moved warm and cold water a little way from their usual place.
How to read the map
On the interactive map, tap or click the water for the exact difference, in °C or °F (use the switch in the header). With a mouse, the difference under the pointer shows as you move. Light grey is sea ice, or water at the ice edge where the 1991–2020 average has no value.
Where the numbers come from
NOAA Coral Reef Watch computes the anomaly each day from its CoralTemp analysis, which blends several satellites into a gap-free map of night-time sea surface temperature in cells of 5 km3 mi, and from a climatology for each day of the year over 1991 to 2020. This page uses that product as published; the averages per ocean, sea and spot are our own, weighted by area. The location pages compare each place with its own 2003–2025 monthly average instead, so their "difference from normal" can differ from this map. Marine heatwaves use the same 1991–2020 period but a stricter test, the warmest tenth of days for at least five days in a row: see the marine heatwave tracker.