

Historical ocean temperatures
How warm the world's ocean surface has been every month and every year since September 1981, compared with the 1991–2020 average, from NOAA's OISST record of satellite, ship and buoy measurements. Updated each month.
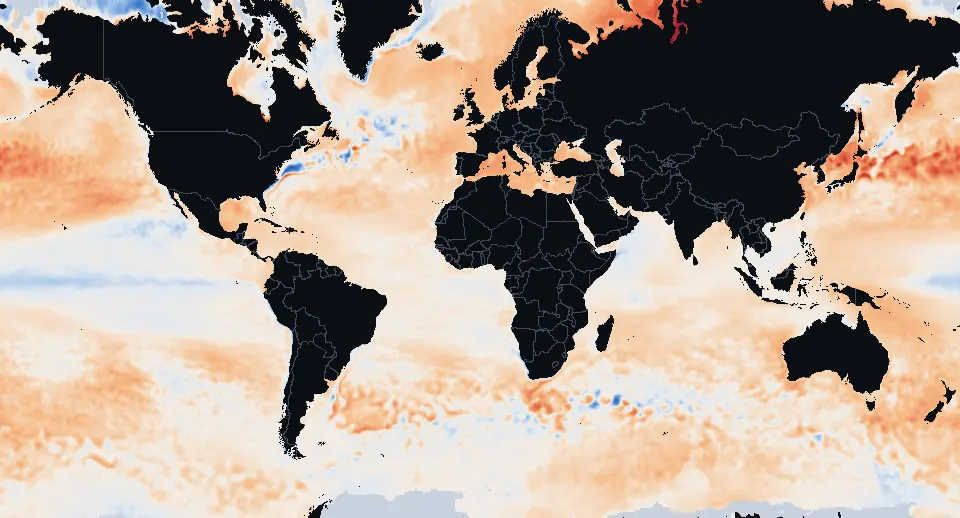
2025: the world ocean (60°S–60°N) averaged +0.47°C+0.85°F against 1991–2020.
The world ocean year by year
Each bar is a year's average sea surface temperature between 60°S and 60°N, compared with the 1991–2020 average of 20.4°C68.7°F. The ten warmest years, all since 2015: 2015, 2016, 2017, 2019, 2020, 2021, 2022, 2023, 2024, 2025.
Warmest years
- 2024 +0.59°C+1.06°F
- 2023 +0.54°C+0.97°F
- 2025 +0.47°C+0.85°F
- 2020 +0.33°C+0.59°F
- 2016 +0.32°C+0.58°F
- 2015 +0.30°C+0.54°F
- 2019 +0.30°C+0.54°F
- 2022 +0.30°C+0.54°F
- 2021 +0.28°C+0.50°F
- 2017 +0.26°C+0.47°F
How the ocean has changed since the 1980s
The average sea surface temperature of 2016–2025 compared with 1982–1991: 97% of the ocean between 60°S and 60°N got warmer, by +0.64°C+1.15°F on average. The strongest warming is in the northwest Pacific east of Japan, the northwest Atlantic, the Baltic, Black and Mediterranean Seas and the South Atlantic off Uruguay and Argentina; the band along the equator in the eastern Pacific and parts of the Southern Ocean near Antarctica changed little or cooled.
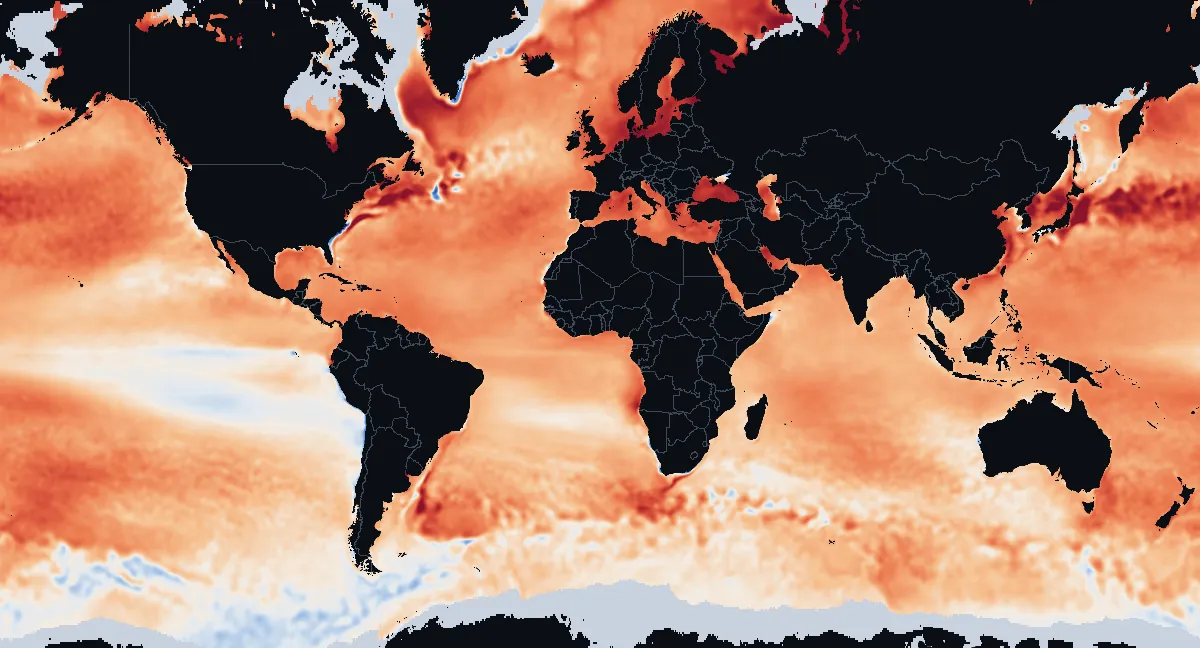
By ocean and sea
| Ocean or sea | 2025 against 1991–2020 | Change since 1982–1991 | Warmest year |
|---|---|---|---|
| Atlantic Ocean | +0.4°C+0.7°F | +0.7°C+1.2°F | 2024 |
| Arctic Ocean | +0.5°C+0.9°F | +0.7°C+1.2°F | 2016 |
| Pacific Ocean | +0.5°C+0.9°F | +0.6°C+1.1°F | 2023 |
| Indian Ocean | +0.4°C+0.8°F | +0.5°C+1.0°F | 2024 |
| Southern Ocean | +0.3°C+0.6°F | +0.1°C+0.2°F | 1992 |
| North Sea | +1.0°C+1.8°F | +1.4°C+2.5°F | 2025 |
| Mediterranean Sea | +1.1°C+2.0°F | +1.2°C+2.2°F | 2024 |
| Gulf of Mexico | +0.9°C+1.6°F | +0.9°C+1.7°F | 2023 |
| Caribbean Sea | +0.6°C+1.2°F | +0.9°C+1.7°F | 2024 |
What the ocean figures cover
Ocean figures cover the open water inside each ocean's outline, so the Arctic and Southern Oceans describe only their ice-free water; "change" compares the last ten complete years with the first ten.
Year-by-year figures
Show the table (1982–2025)
| Year | Average | Against 1991–2020 |
|---|---|---|
| 2025 | 20.87°C69.57°F | +0.47°C+0.85°F |
| 2024 | 21.00°C69.80°F | +0.59°C+1.06°F |
| 2023 | 20.93°C69.67°F | +0.54°C+0.97°F |
| 2022 | 20.71°C69.28°F | +0.30°C+0.54°F |
| 2021 | 20.71°C69.28°F | +0.28°C+0.50°F |
| 2020 | 20.76°C69.37°F | +0.33°C+0.59°F |
| 2019 | 20.73°C69.31°F | +0.30°C+0.54°F |
| 2018 | 20.63°C69.13°F | +0.22°C+0.40°F |
| 2017 | 20.65°C69.17°F | +0.26°C+0.47°F |
| 2016 | 20.75°C69.35°F | +0.32°C+0.58°F |
| 2015 | 20.71°C69.28°F | +0.30°C+0.54°F |
| 2014 | 20.60°C69.08°F | +0.17°C+0.31°F |
| 2013 | 20.46°C68.83°F | +0.05°C+0.09°F |
| 2012 | 20.43°C68.77°F | +0.01°C+0.02°F |
| 2011 | 20.37°C68.67°F | −0.04°C−0.07°F |
| 2010 | 20.51°C68.92°F | +0.08°C+0.14°F |
| 2009 | 20.48°C68.86°F | +0.08°C+0.14°F |
| 2008 | 20.37°C68.67°F | −0.04°C−0.07°F |
| 2007 | 20.38°C68.68°F | −0.03°C−0.05°F |
| 2006 | 20.43°C68.77°F | +0.02°C+0.04°F |
| 2005 | 20.47°C68.85°F | +0.06°C+0.11°F |
| 2004 | 20.39°C68.70°F | −0.02°C−0.04°F |
| 2003 | 20.43°C68.77°F | +0.02°C+0.04°F |
| 2002 | 20.37°C68.67°F | −0.03°C−0.05°F |
| 2001 | 20.33°C68.59°F | −0.07°C−0.13°F |
| 2000 | 20.20°C68.36°F | −0.20°C−0.36°F |
| 1999 | 20.17°C68.31°F | −0.24°C−0.43°F |
| 1998 | 20.39°C68.70°F | −0.03°C−0.05°F |
| 1997 | 20.33°C68.59°F | −0.08°C−0.14°F |
| 1996 | 20.18°C68.32°F | −0.23°C−0.41°F |
| 1995 | 20.22°C68.40°F | −0.18°C−0.32°F |
| 1994 | 20.15°C68.27°F | −0.25°C−0.45°F |
| 1993 | 20.13°C68.23°F | −0.27°C−0.49°F |
| 1992 | 20.13°C68.23°F | −0.28°C−0.50°F |
| 1991 | 20.19°C68.34°F | −0.21°C−0.38°F |
| 1990 | 20.19°C68.34°F | −0.20°C−0.36°F |
| 1989 | 20.10°C68.18°F | −0.31°C−0.56°F |
| 1988 | 20.16°C68.29°F | −0.24°C−0.43°F |
| 1987 | 20.20°C68.36°F | −0.20°C−0.36°F |
| 1986 | 20.03°C68.05°F | −0.36°C−0.65°F |
| 1985 | 19.98°C67.96°F | −0.43°C−0.77°F |
| 1984 | 20.09°C68.16°F | −0.32°C−0.58°F |
| 1983 | 20.19°C68.34°F | −0.22°C−0.40°F |
| 1982 | 20.11°C68.20°F | −0.30°C−0.54°F |
What the maps show
Each picture compares a month, or a whole year, with the average for the same month over 1991 to 2020, the current standard climate period: red water was warmer than that average, blue water cooler. Early years look mostly blue because the ocean was cooler then than in 1991–2020; recent years look mostly red. Strong El Niño years, such as 1997–98, 2015–16 and 2023–24, stand out with a band of red along the equator in the eastern Pacific, and La Niña years with a blue one.
The figures for "the world ocean" cover the sea between 60°S and 60°N, the usual way of summing up the world's sea surface temperature: nearer the poles, sea ice comes and goes and the water under it stays at the freezing point.
Where the numbers come from
NOAA's Optimum Interpolation Sea Surface Temperature (OISST) version 2.1 blends satellite measurements with temperatures from ships and buoys into a daily map in cells of a quarter of a degree, about 25 km16 mi, and NOAA's Physical Sciences Laboratory publishes its monthly means from September 1981. We compare each month with PSL's 1991–2020 monthly averages from the same record and average the cells by their area. The daily maps elsewhere on this site use a different NOAA product (CoralTemp, 5 km3 mi cells), so a figure here can differ slightly from the same month on another page. For today's ocean, see the temperature anomaly map.