

Wave height map
Significant wave height across the world's oceans from NOAA's GFS-Wave model, for November 22, 2026, 12:00 UTC. The map is refreshed twice a day, after the model's 00 and 12 UTC runs.
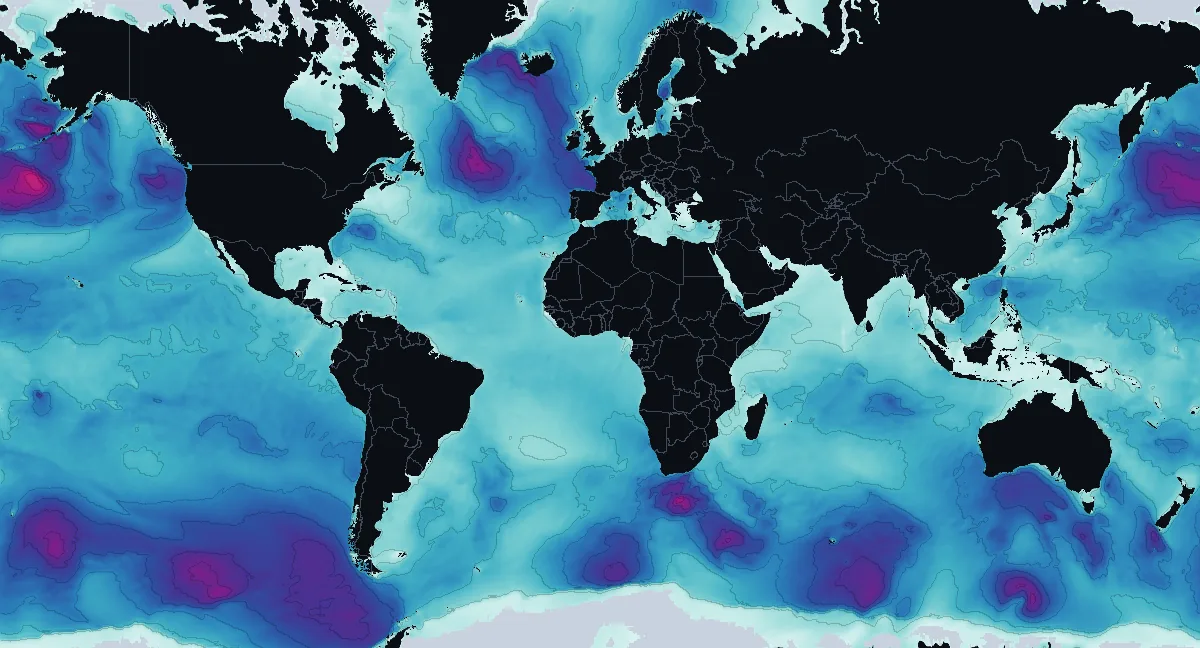
Open the interactive wave map Surf forecasts
Wave height by ocean and sea
| Ocean or sea | Average | Rough end | Highest | Over 4 m13 ft |
|---|---|---|---|---|
| Pacific Ocean | 2.5 m8 ft | 4.3 m14 ft | 8.6 m28 ft 46°N 170°W | 10% |
| Indian Ocean | 2.2 m7 ft | 4.0 m13 ft | 7.5 m25 ft 41°S 24°E | 8% |
| Atlantic Ocean | 2.0 m6 ft | 3.5 m11 ft | 7.1 m23 ft 49°N 37°W | 5% |
| Southern Ocean | 1.9 m6 ft | 4.3 m14 ft | 5.7 m19 ft 61°S 130°E | 15% |
| Arctic Ocean | 1.2 m4 ft | 2.3 m8 ft | 3.7 m12 ft 72°N 32°E | 0% |
| Mediterranean Sea | 1.1 m4 ft | 2.2 m7 ft | 3.3 m11 ft 43°N 7°E | 0% |
| North Sea | 1.5 m5 ft | 1.8 m6 ft | 2.2 m7 ft 61°N 2°E | 0% |
| Caribbean Sea | 1.0 m3 ft | 1.4 m5 ft | 1.7 m5 ft 11°N 61°W | 0% |
| Gulf of Mexico | 0.8 m2 ft | 1.0 m3 ft | 1.3 m4 ft 21°N 97°W | 0% |
What significant wave height means
Significant wave height is the average height of the highest third of the waves, measured from trough to crest. It is close to the height an experienced sailor would report by eye, and it is the number wave forecasts give. The waves around it vary: some are lower, and in a few hours of the same sea the highest single wave can be nearly twice as high.
The figure counts every wave together, the long swell from distant storms and the short, steep sea raised by the local wind. Long-period swell from the Southern Ocean and the North Pacific crosses whole oceans and reaches coasts thousands of kilometres away, which is why a calm-looking day at the beach can still bring big surf.
How to read the map
Pale aqua is calm water, blue and indigo are rough seas, and purple and magenta are storm seas over about 6 m20 ft. The faint lines are contours every metre (3 ft). Sea ice is light grey, and land, and seas the model leaves out, are dark. With a mouse, the wave height under the pointer shows as you move over the picture; the interactive map gives the exact value, the wave period and the direction the waves come from.
Where the numbers come from
NOAA's GFS-Wave model (WAVEWATCH III, run by the National Centers for Environmental Prediction) computes the waves on a global grid of 0.25°, about 25 km16 mi, four times a day, driven by the winds of the GFS weather model. This map shows the start of the 00 and 12 UTC runs, the model's analysis of the sea at that hour. A model describes open water: near the coast, the sea bed, headlands, reefs and harbour walls change the waves a lot, so a beach can see much smaller or bigger waves than the nearest cell. The map is for understanding the oceans, not for navigation.