

Marine heatwave tracker
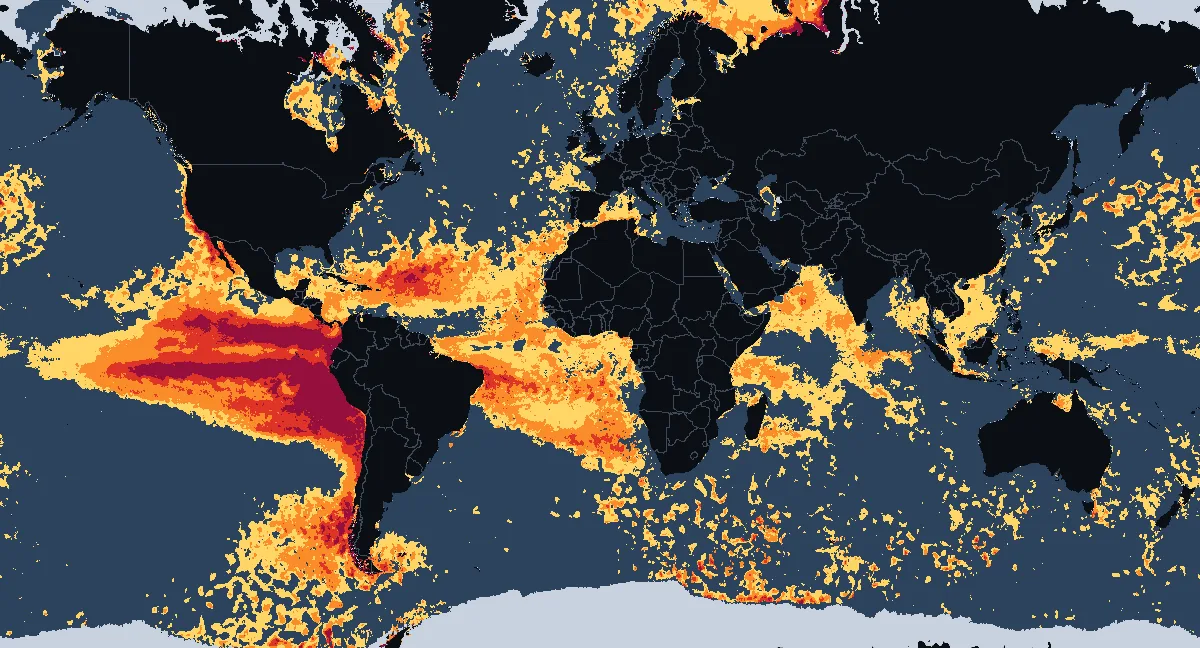
Where the sea surface is in a marine heatwave today, how strong it is and how long it has lasted, measured against the 1991–2020 average with NOAA's daily satellite sea temperatures, for November 21, 2026. Updated once a day.
Open the interactive heatwave map
Seas and ocean areas in a marine heatwave
| Sea or ocean area | In a heatwave | Strong or worse | Highest category | For | vs 1991–2020 |
|---|---|---|---|---|---|
| Kara Sea | 92% | 83% | Extreme | at least 10 days | — |
| Arctic Ocean | 62% | 41% | Extreme | at least 10 days | — |
| Gulf of California | 100% | 93% | Severe | at least 10 days | +3.6°C+6.4°F |
| Sargasso Sea | 63% | 41% | Severe | at least 10 days | +1.1°C+2.1°F |
| Caribbean Sea | 86% | 41% | Strong | at least 10 days | +1.0°C+1.8°F |
| Laccadive Sea | 96% | 35% | Strong | 5 days | +1.1°C+2.0°F |
| Gulf of Carpentaria | 83% | 33% | Strong | at least 10 days | +1.2°C+2.2°F |
| Barents Sea | 89% | 33% | Strong | at least 10 days | +1.8°C+3.2°F |
| Arabian Sea | 82% | 26% | Strong | at least 10 days | +0.9°C+1.6°F |
| Gulf of Guinea | 97% | 17% | Strong | at least 10 days | +0.9°C+1.6°F |
| Bay of Campeche | 95% | 16% | Strong | at least 10 days | +1.5°C+2.6°F |
| Hudson Bay | 55% | 9% | Moderate | 2 days | — |
| Andaman Sea | 82% | 4% | Moderate | 4 days | +1.0°C+1.7°F |
| South China Sea | 75% | 4% | Moderate | at least 10 days | +1.0°C+1.9°F |
| Gulf of Thailand | 52% | 0% | Moderate | 1 day | +0.9°C+1.7°F |
How the table works
A sea is listed when at least half of its assessed water is in a heatwave today. "Highest category" is the strongest that covers at least a tenth of the area; "For" counts the days in a row with at least half the water in a heatwave, as far back as our record goes (10 days so far). The last column is the area's average difference from the 1991–2020 average, from the anomaly analysis.
By ocean and sea
| Ocean or sea | In a heatwave | Strong or worse | Severe or worse | Highest category | vs 1991–2020 |
|---|---|---|---|---|---|
| Pacific Ocean | 35% | 21% | 12% | Severe | +0.9°C+1.7°F |
| Atlantic Ocean | 46% | 23% | 4% | Strong | +0.8°C+1.4°F |
| Arctic Ocean | 55% | 20% | 7% | Strong | +1.0°C+1.8°F |
| Indian Ocean | 27% | 6% | <1% | Moderate | +0.6°C+1.2°F |
| Southern Ocean | 19% | 5% | 1% | Moderate | +0.7°C+1.3°F |
| Caribbean Sea | 86% | 41% | 1% | Strong | +1.0°C+1.8°F |
| Gulf of Mexico | 44% | 9% | 0% | Moderate | +1.0°C+1.8°F |
| Mediterranean Sea | 26% | 5% | 0% | Moderate | +1.0°C+1.8°F |
| North Sea | 17% | 0% | 0% | Moderate | +0.6°C+1.1°F |
Hardly any heatwave today (under 10% of the water): Adriatic Sea, Arafura Sea, Banda Sea, Bering Sea, Bismarck Sea, Black Sea, Ceram Sea, Chukchi Sea, Coral Sea, Flores Sea, Great Australian Bight, Gulf of Alaska, Gulf of Bothnia, Makassar Strait, Molucca Sea, Philippine Sea, Sea of Okhotsk, Shelikhov Gulf, Solomon Sea, Sulu Sea.
What a marine heatwave is
A marine heatwave is a stretch of days when the sea is unusually warm for the time of year: warmer than the temperature it exceeds on only one day in ten, the 90th percentile of the past record for that place and date. Scientists name its strength by how far above the threshold it goes, counted in steps the size of the gap between the usual temperature and the threshold (Hobday and colleagues, 2018):
- Moderate up to twice the gap above the usual temperature
- Strong two to three times the gap
- Severe three to four times
- Extreme four times the gap or more
Heatwaves at sea can last weeks or months and cover thousands of kilometres. They can bleach corals, kill seagrass and kelp, move fish stocks and feed stronger storms. Heat stress on coral reefs is tracked separately on the coral bleaching tracker.
Why so much of the ocean is in a heatwave
The thresholds come from the 30 years 1991 to 2020, the current standard climate period. The sea surface has kept warming since, so warmth that was among the warmest tenth of days then is common now: on November 21, 2026 36% of the assessed ocean had been above its threshold for at least 5 days in a row. The stronger categories are rarer: 7% of the ocean was Severe or worse. A fixed baseline shows how far today's ocean has moved from the one of recent decades; some scientists prefer one that moves with the warming, which would show only the unusual events on top of it.
How we count a heatwave
Every day we compare the sea surface temperature of each cell of about 10 km6 mi with that cell's 1991–2020 average and threshold for the date. A cell is in a marine heatwave once it has been above its threshold for 5 days in a row, the minimum in the scientific definition, and its category is set each day by how far above it is. Water with sea ice today is not assessed and is left out of every share.
For the tables we add up the cells inside each named sea, gulf and bay (as outlined in Natural Earth's marine areas) and inside each ocean: the share of the water in each category, the strongest category covering at least a tenth of it, and how many days in a row at least half of its water has been in a heatwave. Our home page names a sea after 5 such days.
Where the numbers come from
Today's temperatures are NOAA Coral Reef Watch's CoralTemp satellite analysis, the same as everywhere on this site, published each afternoon for the day before. The average and the threshold (the 90th percentile) for each place and day of the year come from the Danish Meteorological Institute, which computed them for 1991 to 2020 from the European Space Agency's climate record of sea surface temperature with the method of Hobday et al. (2016): an 11-day window around each date, smoothed over 31 days. The two records agree closely: against the same 1991–2020 period their averages differ by less than a tenth of a degree on average.