

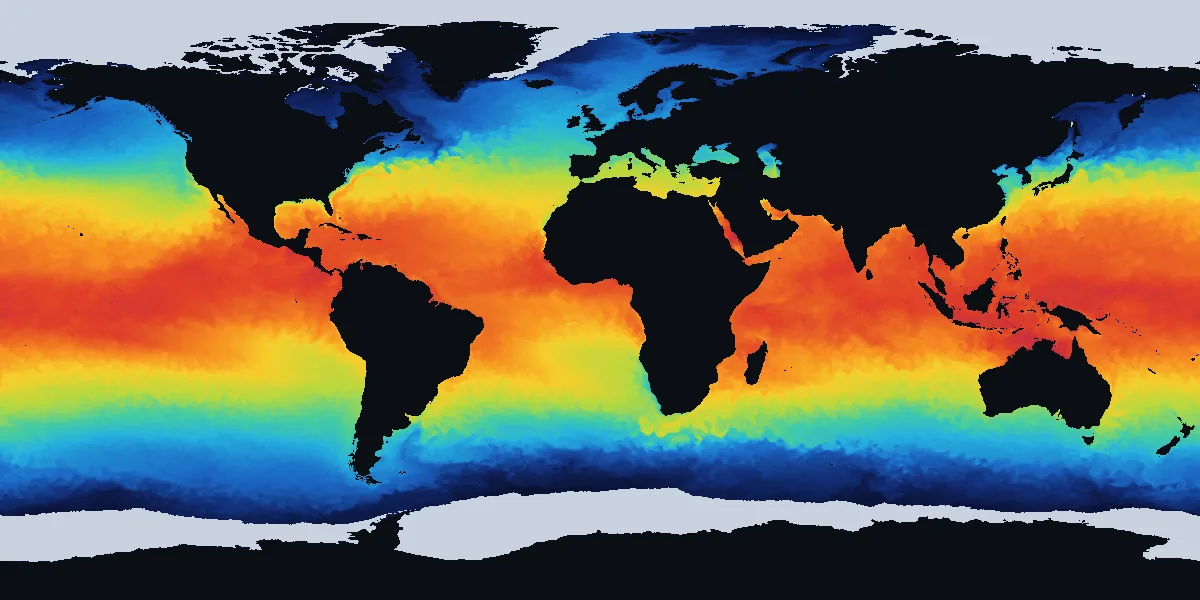
Ocean temperature map
What the map shows
Each colour is the night-time sea surface temperature of a 5 km3 mi cell on the date shown, from NOAA Coral Reef Watch's CoralTemp analysis: blue for cold water, green and yellow for mild, orange and red for warm. The faint lines are contours every 1°C2°F. Land is black with country borders, and sea ice is left light grey. The map is updated once a day, usually in the afternoon US Eastern time, with the previous day's analysis.
How to use it
Zoom and pan to any coast. With a mouse, the water temperature under the pointer shows as you move; tap or click a point for the exact reading, with the nearest location page one tap away; the white dots are the coastal locations we track, each linking to its page. Use the search box to jump to a beach, city, region or sea, and the °C/°F switch in the header to change the unit everywhere on the site. If the interactive map does not load, the image still shows today's picture and the location pages work without it.
Wave height layer
Switch the map to Waves in its legend to see significant wave height across the oceans, from NOAA's GFS-Wave model run of 2026-11-22 12:00 UTC, refreshed twice a day: pale water is calm, blue and indigo rough, magenta a storm sea. Tap the water for the height, the wave period and the direction the waves come from. The wave height map page explains the numbers and lists the roughest water in each ocean today.
Ocean currents layer
Switch the map to Currents to see the speed of the water at the surface, from NOAA's RTOFS ocean model, with moving trails showing where it flows: dark blue water barely moves, teal and green flow at walking pace or less, and yellow, orange and red mark the fast currents such as the Gulf Stream and the Agulhas. Tap the water for the speed and direction. The ocean currents map page names the fastest currents today.
Temperature anomaly layer
Switch the map to Anomaly to see how much warmer or cooler than the 1991–2020 average for the date the sea surface is, from NOAA Coral Reef Watch for 2026-11-21: red is warmer than normal, blue cooler, near-white about normal. The anomaly map page gives the figures per ocean and sea and the spots furthest from normal today.
Marine heatwave layer
Switch the map to Heatwaves to see where the water is in a marine heatwave, for 2026-11-21: yellow is moderate, orange strong, red severe and crimson extreme. A cell counts once its water has been warmer than the warmest tenth of days of 1991–2020 for at least five days in a row, from NOAA's satellite sea temperatures and the Danish Meteorological Institute's 1991–2020 thresholds. The marine heatwave tracker lists the seas in a heatwave and for how long.
Coral heat stress layer
Switch the map to Coral to see NOAA Coral Reef Watch's coral bleaching heat stress, the highest alert level of the 7 days to 2026-11-21, from no stress through Bleaching Watch and Warning to Alert Levels 1 to 5. The coral bleaching tracker gives the alert level of 214 reef areas.
Ocean depth layer
Switch the map to Depth to see how deep the sea is, from NOAA's ETOPO 2022 model of the sea floor: pale on the shallow continental shelves, darker blue with depth and violet in the trenches, with lines every 1,000 m3,281 ft. Tap the sea for its depth. The ocean depth map page explains the colours and how much of the ocean lies at each depth.
Browse by country
- United States
- Canada
- United Kingdom
- Ireland
- Spain
- Portugal
- France
- Italy
- Greece
- Croatia
- Turkey
- Iceland
- Norway
- Denmark
- Netherlands
- Belgium
- Germany
- Sweden
- Finland
- Estonia
- Latvia
- Lithuania
- Poland
- Mexico
- Bahamas
- Jamaica
- Dominican Republic
- Barbados
- Aruba
- Cayman Islands
- Australia
- New Zealand
- Thailand
- Indonesia
- South Africa
- Brazil
- United Arab Emirates
- Costa Rica
About the map data
Satellite values describe open water near the coast; the water at a beach can differ by several degrees. See the methodology. Borders and country names: Natural Earth (public domain).